The Liquidity Is Coming. The Market Doesn’t Care. Perfect.
📊 Data Verified: 13:50 UK | ETF flows: Farside 11 Dec | Fear & Greed: Alternative.me 13:48 | Derivatives: CoinGlass 13:49 | Price: TradingView 13:42 | Fed Data: FRED/Treasury 09 Dec
At a Glance
| Metric | Reading | Signal |
|---|---|---|
| Bitcoin Price | $90,030 | 🟡 Accumulation zone |
| Days Since QT End | 10 | 🟡 Historical rallies took months, not days |
| October Correction | -37% from $126K | 🟢 May have been our “2019 crash” already |
| Infrastructure vs 2019 | 20x improvement | 🟢 Completely different setup |
| Russell 2000 | +2.05% (5 days) | 🟢 Liquidity canary singing |
| Patient Capital Activity | MicroStrategy buying | 🟢 Smart money accumulating |
Scenario Update:
- Scenario A (October WAS the crash, accumulation now): 60%
- Scenario B (Another leg down to $70-80K): 30%
- Scenario C (Immediate rally from here): 10%
October’s 37% crash from $126K matches 2019’s magnitude. We may already be in the accumulation phase.
Read paths: 2 min (this box) | 5 min (bold sections + blockquotes) | 12 min (full brief)
What’s Happening Now
The Federal Reserve ended 42 months of quantitative tightening on December 1st and announced Treasury purchases on December 10th. Update: The Fed releases its T-bill purchase schedule today (December 11), with $40 billion in buying starting tomorrow. Additionally, the Fed removed all limits on Standing Repo operations, creating unlimited liquidity backstop at 3.75%. First systematic balance sheet expansion since 2020 (excluding 2023’s emergency banking measures). The Russell 2000 surged 2.05%. Bitcoin dropped 2%.
Crypto Twitter declared the Fed pivot a failure. “If this can’t break $100K, nothing will.”
They’re looking at the wrong calendar.
When the Fed ended QT on July 31, 2019, Bitcoin crashed 35% over the following months. The real rally didn’t start until QE arrived. But consider: Bitcoin already crashed 37% from $126,199 in October to $79,000 in November. We might have already had our “2019-style” correction.
The infrastructure is different. The crash may have already happened.
Bottom line: History shows liquidity takes months to impact Bitcoin, not days. October’s 37% crash might have been our “2019 moment.” The infrastructure difference means better absorption when liquidity arrives.
Act I: The Noise – “Another Failed Pivot”
Yesterday’s Fed meeting delivered exactly what markets expected: 25 basis point cut, Treasury purchases announced, dovish tone maintained. Bitcoin’s response? Spike to $94,500. Dump to $90,000. Another rejection.
The narrative wrote itself. “Fed pivot can’t even break $100K.” “Liquidity isn’t helping.” “Bull market exhaustion.”
Fear & Greed at 28 confirms maximum pessimism. ETF outflows turned to inflows December 9-10 (+$375M combined) yet price remains stuck. Even MicroStrategy’s relentless bid can’t push price higher. The mood has shifted from euphoria to exhaustion in six weeks.
Surface Evidence of Failure:
- Fourth rejection at $100K resistance 🔴
- Russell 2000 rallying while Bitcoin stagnates 🟡
- ETH/BTC holding above 0.035 support (barely) 🟡
- Liquidations despite sideways price action 🔴
- Yet ETF flows quietly turning positive (institutional accumulation?) 🟢
The consensus is clear: Fed pivot failed. Bull market stalled. Better luck next cycle.
Act II: The Debunk – History Doesn’t Repeat, It Teaches
Everyone citing “Fed pivot = moon” skipped the homework.
What Actually Happened in 2019:
July 31, 2019: Fed ends QT. Bitcoin at $9,400.
August 2019: Brief rally to $12,000.
September 2019: Repo market seizes up, forcing Fed emergency intervention. Bitcoin crashes to $7,800 (-35%).
October-February: Continued decline without crisis catalyst.
March 13, 2020: COVID crash to $3,800.
March 23, 2020: Fed announces unlimited QE.
Many months later: Bitcoin finally sustains rally above QT-end price.
The lesson? QT ending marks the start of accumulation, not the rally. In 2019, a repo crisis forced emergency Fed action. Today’s Standing Repo Facility prevents such seizures but may result in slower, more measured responses - though the 20x infrastructure improvement likely overwhelms any delay.
But Here’s What’s Different:
2019 vs 2025: The Infrastructure Revolution
| Category | 2019 | 2025 | Impact |
|---|---|---|---|
| ACCESS POINTS | |||
| Spot ETF AUM | $0 | $110 billion | Direct institutional highway |
| Corporate Treasury BTC | ~0 | 1,700,000+ | ∞ (from zero) |
| MARKET DEPTH | |||
| Daily Spot Volume | $5 billion | $97 billion | 19.4x absorption capacity |
| Derivatives OI | $3 billion | $134 billion | Deep liquidity (but higher volatility) |
| RISK INFRASTRUCTURE | |||
| Custody Solutions | Experimental | Bank-grade standard | Institutional confidence |
| Exchange Insurance | None | $1+ billion | Counterparty risk removed |
| Regulatory Framework | Hostile | Transitioning positive | January 20 catalyst |
| MARKET STRUCTURE | |||
| 24/7 Trading | Limited | Global standard | No weekend gaps |
| On-chain Analytics | Basic | Institutional grade | Transparency |
| Mining Hashrate | 90 EH/s | 850 EH/s | 9.4x network security |
When liquidity arrives this time, it has superhighways into Bitcoin, not dirt roads. Critical point: ETF holders historically demonstrate lower volatility than direct holders - this infrastructure is “stickier” than 2019’s retail-dominated structure.
Act III: The Pivot – Russell Knows, Bitcoin Doesn’t (Yet)
While retail panics about $90K, traditional markets are sending clear signals.
The Russell 2000’s 2.05% surge confirms what bond markets show: liquidity conditions are improving. Small-caps, lacking buybacks and financial engineering, respond purely to credit availability. When money gets easier, they move first.
The Liquidity Signal Chain:
- Fed policy shifts (December 1-10) ✓ 🟢
- Bond yields adjust (happening now) 🟢
- Small-caps respond (Russell +2.05%) ✓ 🟢
- Credit spreads tighten (beginning) 🟡
- Risk assets follow (Bitcoin still waiting) 🔴
Bitcoin sits at step 5 of a multi-step process. The lag isn’t failure - it’s mechanical.
MicroStrategy as Infrastructure, Not Signal:
- December 8: Bought 10,624 BTC at $90,615
- December 1: Bought 10,000 BTC at $89,959
- November 24: Bought 8,178 BTC at $102,171
- Total Holdings: 660,624 BTC (3% of all Bitcoin that will ever exist)
No price sensitivity. No macro timing. Just systematic accumulation in regular blocks regardless of conditions. They’ve raised $21 billion in 2025 and continue accessing capital markets.
Why This Matters: MicroStrategy isn’t evidence of smart timing - they’re PART of the infrastructure difference. Their predictable weekly buying creates consistent demand that didn’t exist in 2019. Another superhighway for liquidity absorption. They’ve become Bitcoin’s buyer of last resort, providing floor support regardless of sentiment.
The Russell 2000’s 2.05% surge confirms what patient capital sees: liquidity conditions are improving. Small-caps, lacking buybacks and financial engineering, respond purely to credit availability. Their rally says liquidity is starting to flow.
But Bitcoin operates on a different transmission mechanism:
The Liquidity Pipeline (Historical Patterns, Not Predictions):
- Initial Phase: Fed policy change, Primary Dealers absorb initial issuance before risk desks get leverage
- Reserve Building: Bank reserves expand from current $2.89T, credit conditions ease
- Risk Return: Credit spreads tighten, correlations gradually restore
- Crypto Response: Liquidity eventually reaches outer risk curve
We’re 10 days into an unknown timeline.
Act IV: The Signal – Patience Wins, Timing Uncertain
The opportunity isn’t this month. The timeline is less clear than we’d like.
The Liquidity Turn (FRED Data Confirms):
| Indicator | Current | 6-Month Change | Signal |
|---|---|---|---|
| Fed Balance Sheet (WALCL) | $6.84T | -$320B (QT ending) | 🟡 Stabilizing |
| Bank Reserves (WRESBAL) | $2.89T | At “ample” levels | 🟢 Healthy |
| Reverse Repo (RRPONTSYD) | $121B | -$2.4T from $2.5T peak | 🟢 Liquidity deployed |
| M2 Money Supply | $21.7T | +$800B after 15-month decline | 🟢 Expanding |
| IG Credit Spreads | 93 bps | -27 bps from recent highs | 🟢 Risk appetite returning |
| TGA Balance | $837B | -$63B from November | 🟢 Injecting liquidity |
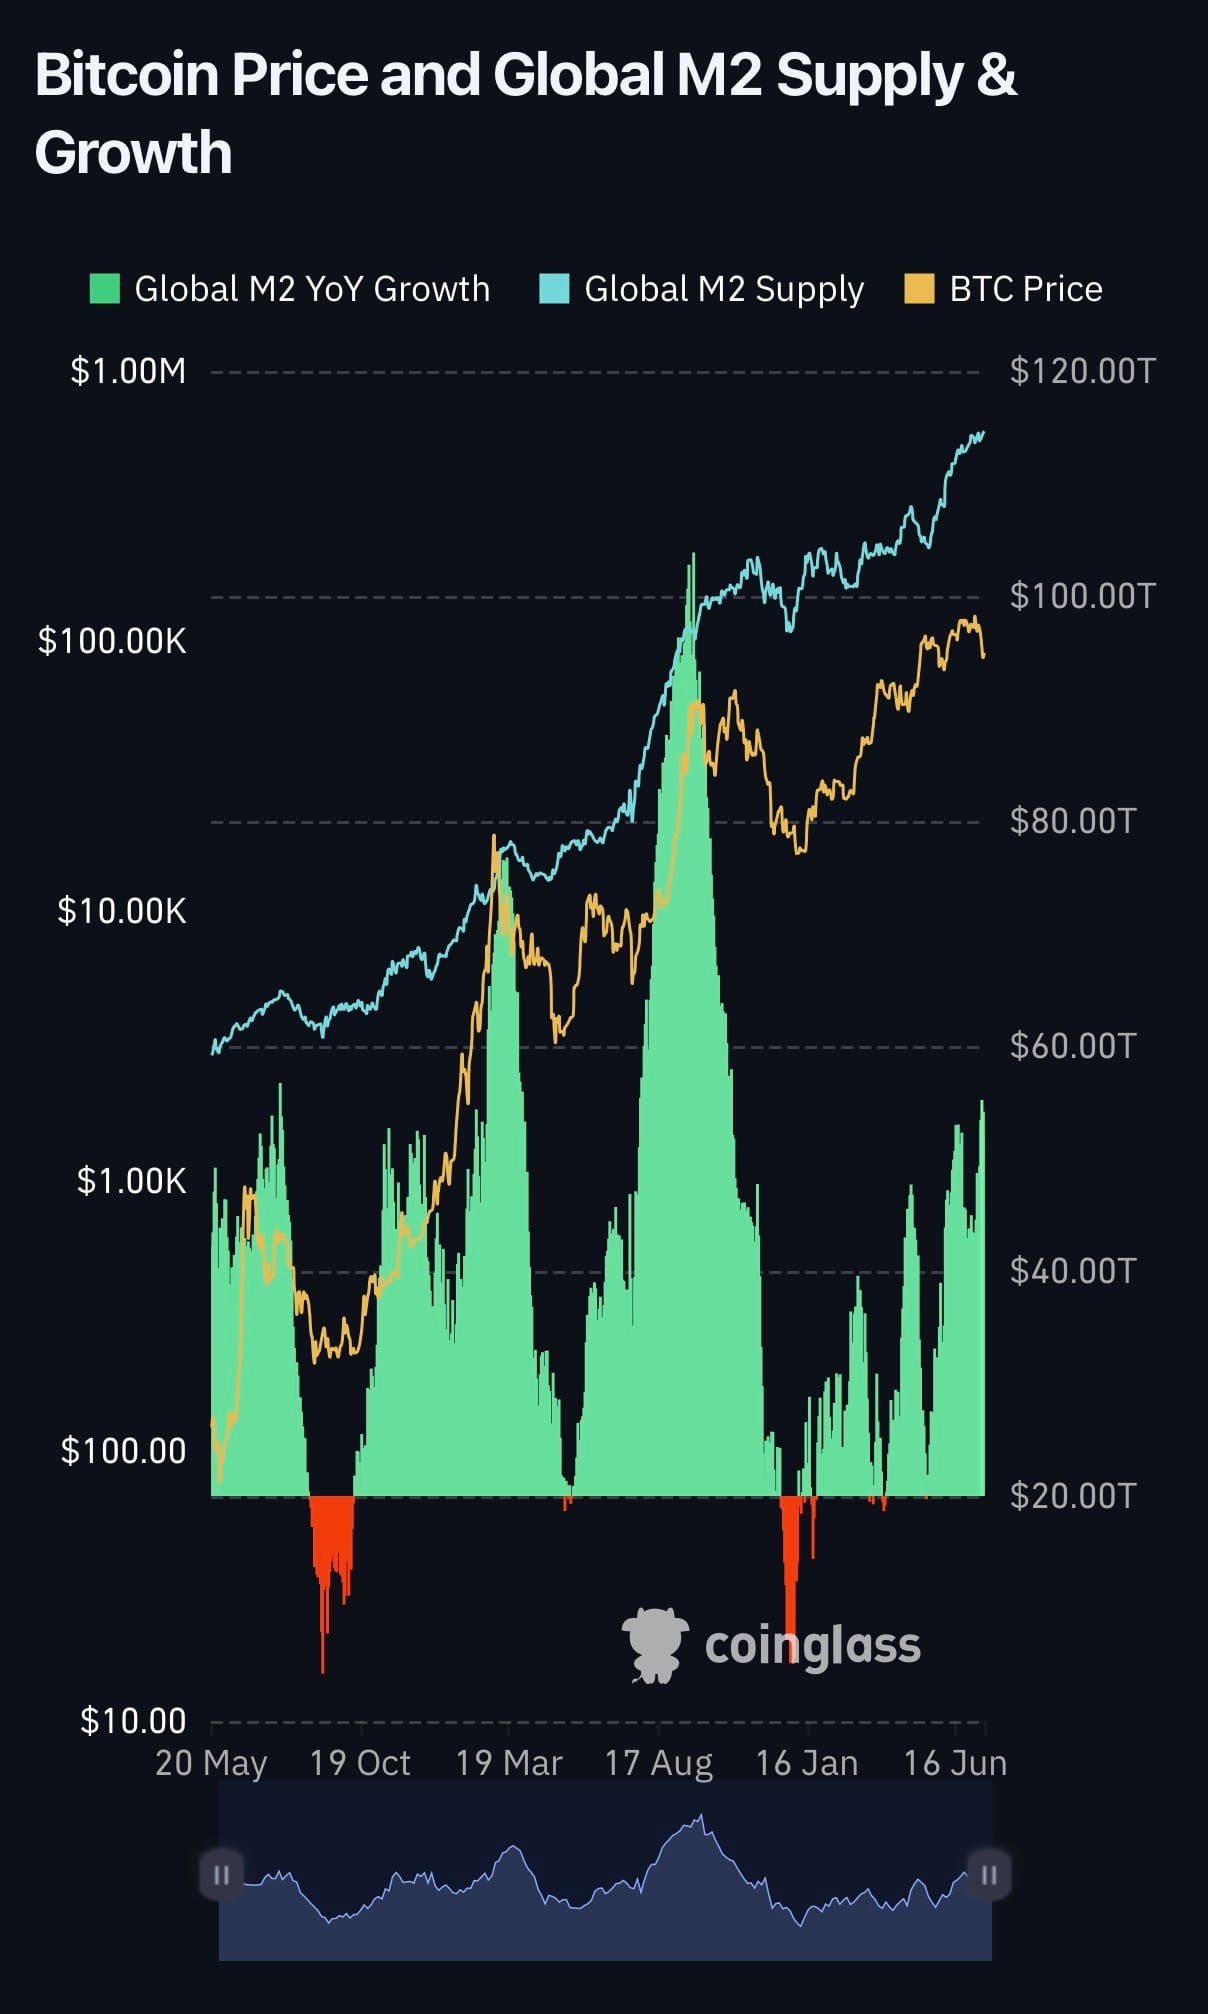
The data shows liquidity conditions already improving. M2 expanding again after the longest contraction since the 1930s. Credit spreads tightening. Reverse repo nearly fully drained. The foundation is set.
The Visual Proof: Global M2 supply and Bitcoin price show near-perfect correlation historically. When M2 growth went negative (2022-2023), Bitcoin crashed. Now M2 is expanding again but Bitcoin lags - exactly the pattern we saw in previous cycles. The divergence creates the opportunity.
Why Liquidity Takes Time (But We Can’t Pin Exact Dates):
Balance Sheet Mechanics: Fed needs months to meaningfully expand reserves from current $2.89T to higher levels.
Credit Transmission: Banks need quarters to expand lending after reserve rebuilds. Credit creation drives risk asset flows.
October’s Crash Changes Everything: Bitcoin already fell 37% from $126K to $79K. In 2019, the 35% crash came AFTER QT ended. This time, it might have come BEFORE. But critical caveat: If October was crypto-specific deleveraging rather than macro-driven, another macro crash remains possible.
Tax Calendar: Q1 2026 will see realized gains from 2025, creating selling pressure through April 15.
Political Timeline: New administration’s crypto framework expected by April 2026.
The Patient Capital Arbitrage:
The Patient Capital Framework:
| Phase | Possible Timeline | Expected Action | Opportunity |
|---|---|---|---|
| Current | Dec 2025 - ? | Post-37% crash consolidation | Accumulation zone? |
| Transition | Q1-Q2 2026? | Volatility both directions | Shakeout wicks |
| Liquidity Arrival | Unknown, historically months | Credit expands to risk assets | Price discovery |
| New Cycle | When liquidity reaches crypto | New ATHs probable | Distribution |
Note: October’s 37% crash complicates timeline predictions. We might be in accumulation already.
Reality Check: If 2019 patterns hold exactly, Bitcoin could test $70,000 before the rally. The infrastructure suggests a higher floor (probably $80,000), but patience through drawdowns remains essential.
Observable Patterns
Pattern 1: The Variable Lag
From QT end to sustainable rally:
- 2019: Took many months and required full QE
- 2025: We’re 10 days in, but already had a 37% crash in October
The infrastructure is different. The exact timeline is unknowable.
Pattern 2: The Volume Multiplier
2019: $5B daily volume meant slow liquidity absorption.
2025: $97B daily volume means 20x faster absorption when it arrives.
The lag remains, but the violence of the catch-up increases.
Pattern 3: The MicroStrategy Constant
MicroStrategy has bought every single week regardless of price or macro conditions. They’re not trading or timing - they’re infrastructure. $21 billion deployed systematically creates a consistent bid that didn’t exist in 2019.
Week Ahead
December 12: CPI data. CRITICAL EVENT: Consensus 2.7%. If exceeds 3.0%, Fed could pause T-bill purchases, breaking liquidity thesis. 🔴
December 13: Consumer sentiment. Watch inflation expectations. 🟡
December 16-20: Tax loss selling peak. Historical maximum pressure. 🔴
December 20: $4.2B Bitcoin options expiry. Max pain: $92,000. 🟡
January 1: New liquidity regime psychology begins. 🟢
January 20: Inauguration. Regulatory clarity countdown starts. 🟢
The Close
Everyone wants the Fed pivot to deliver instant gratification. History says that’s not how liquidity works.
July 2019 taught us QT ending means accumulation opportunity, not immediate rally. It took months and a 35% crash before Bitcoin responded to Fed liquidity. But October 2025 already delivered a 37% crash from $126K to $79K. We might be further along than it appears.
Today’s infrastructure can absorb 20x more liquidity much faster. When the transmission mechanism finally connects, the move will be substantial.
Russell 2000 sees the liquidity improving. MicroStrategy continues its mechanical accumulation. Retail is too impatient to wait.
The market is offering an accumulation window while building the greatest liquidity injection since 2020. In 2019, patience meant enduring a 35% crash AFTER QT ended. In 2025, we may have already had that crash in October.
Final Signal: The Fed pivot isn’t failing. Liquidity takes time to reach Bitcoin. October’s 37% crash might have been our pain payment already. Patient capital isn’t buying for December. They’re accumulating for when liquidity finally arrives.
The opportunity isn’t $100K. It’s accumulating before liquidity makes $200K inevitable.
Risk Acknowledgment: October’s 37% correction may have been our major drawdown, but another 20-30% leg down to $70K remains possible. Critical Invalidation: If December 12 CPI exceeds 3.0% and Fed pauses T-bill purchases, the liquidity pipeline breaks. Scenario B ($70K) becomes base case. The 2019 precedent included a repo market seizure that forced the Fed’s hand - today’s Standing Repo Facility provides smoother transitions but potentially slower responses. Tax selling and Q1 seasonality add pressure. QE may not arrive if economy strengthens.
Disclaimer: This publication provides market analysis for educational purposes only. Not financial advice. Not a solicitation to buy or sell securities. Cryptocurrency investments carry substantial risk of complete loss. Consult qualified financial advisors.
Sources: Federal Reserve | US Treasury | FRED | CoinGlass | TradingView | Farside Investors | Alternative.me | MicroStrategy.com