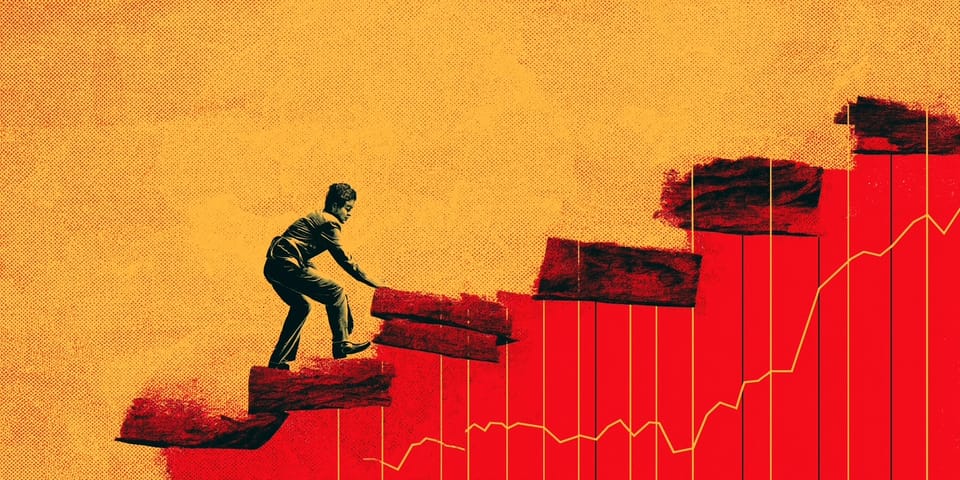
The Violence Is Over: Bitcoin's 99% Liquidation Collapse Signals Market Reset
📊 Data Verified: 08:45 UK | ETF flows: DeFiLlama Nov 28 | Fear & Greed: Alternative.me 25 | Derivatives: CoinGlass 08:40 | Price: TradingView $91,161
At a Glance
| Metric | Reading | Signal |
|---|---|---|
| Bitcoin Price | $91,161 | 🟢 Holding above $90K |
| Fear & Greed | 25 (Extreme Fear) | 🟢 Capitulation conditions |
| Daily Liquidations | $166M | 🟢 Down 99% from peak |
| Funding Rate | 0.0049% | 🟢 Neutral (healthy) |
| ETF Flows (week) | -$664M total, stabilizing | 🟡 Outflows exhausting |
| Cycle Indicators | 1/30 triggered | 🟢 Mid-cycle |
| QT Ends | 3 days | 🟢 Potential headwind removal |
Market Conditions:
- Liquidations collapsed from October peak
- Sentiment at extreme fear despite price recovery
- Derivatives reset to neutral
Read paths: 2 min (this box) | 5 min (bold sections) | 12 min (full brief)
What's Happening Now
Bitcoin trades at $91,161 after October's massive deleveraging event. The October 10 liquidation cascade wiped out $19.14 billion in 24 hours. Current daily liquidations: $166 million. This 99.1% decline in forced selling represents a fundamental shift in market structure.
The size and collapse of forced selling tells us more about market structure than spot price does. Prices show panic; liquidations show whether the panic still has fuel. And right now, the fuel is gone.
This brief examines liquidation patterns, institutional flow data, and Treasury balance dynamics for educational context about current market conditions.
Educational Purpose: This analysis examines historical patterns and market data for educational purposes only. No financial advice is provided or intended.
The Market Narrative
Financial headlines focus on Bitcoin's struggle at $90,000. Fear & Greed sits at 25. November recorded $3.6 billion in ETF outflows, the second-worst month since launch. The October all-time high of $126,080 feels distant after a 27.7% drawdown.
The consensus view: exhausted bull market, institutional retreat, cycle peak.
The data suggests a different interpretation.
Liquidation Analysis
📊 The Violence Collapse
| Metric | October 10 | November 27 | Change |
|---|---|---|---|
| 24h Liquidations | $19,140M | $166M | -99.1% |
| Funding Rate | >0.1% | 0.0049% | -95% |
| Market Impact | Cascade | Negligible | 🟢 |
October 10, 2025: $19.14 billion liquidated in 24 hours (source: CoinGlass historical data) November 27, 2025: $166.06 million liquidated in 24 hours (source: CoinGlass)
This represents a 99.13% reduction in daily forced selling.
Price moves can be noise. Forced selling is signal. Price shows emotion; liquidations show structure.
Current funding rates (source: CoinGlass):
- Bitcoin: 0.0049%
- Ethereum: 0.0032%
These near-zero rates contrast with typical bull market funding of 0.01-0.03% and overheated conditions above 0.1%.
Total open interest stands at $131.79 billion, stable but not building. The derivatives market has reached equilibrium after October's flush.
Forced selling collapsing is only part of the picture. What matters next is whether sidelined capital and institutions step into the vacuum. The data over the last 10 days gives us clues.
If liquidations tell us where the panic ends, flows and liquidity tell us what comes next. The rest of this brief connects those pieces.
Institutional Activity
🏦 Who's Buying the Fear
| Entity | BTC Amount | Avg Price | Date | Signal |
|---|---|---|---|---|
| El Salvador | 1,090 | $92,125 | Nov 18 | 🟢 |
| Texas | 57 | $87,000 | Nov 20 | 🟢 |
| DDC Enterprise | 100 | -- | Nov 26 | 🟢 |
| Bitplanet | 45 | $93,000 | Nov 26-27 | 🟢 |
| Total November | 1,292 BTC | ~$90,000 |
Pattern: Sovereign and corporate accumulation accelerates below $93K
Stablecoin Positioning
Current metrics (source: DeFiLlama, TradingView):
- Stablecoin market cap: $305.5 billion (+0.79% weekly)
- DeFi TVL: $122.2 billion (+1.39% daily)
- Stablecoin dominance: 10.25% of total crypto market cap
This represents $305 billion in capital within the crypto ecosystem but not deployed into volatile assets.
ETF Flows: The Tide Turns
📊 November ETF Flows (Source: Farside Investors)
| Date | Total Daily Flow | Signal |
|---|---|---|
| Nov 20 | -$903.2M | 🔴 Peak outflow |
| Nov 21 | +$238.4M | 🟢 Reversal begins |
| Nov 24 | -$151.0M | 🟡 Minor outflow |
| Nov 25 | +$128.7M | 🟢 Inflows return |
| Nov 26 | +$21.1M | 🟢 Positive streak |
Key Observations:
- Worst single day: -$1,113.7M (November minimum)
- Last 5 days: Net -$664M but improving
- Last 3 days: 2 of 3 positive
- Trend: Heavy outflows exhausted, flows normalizing
The reversal: After -$903M on November 20 (second-worst day ever), flows have stabilized. The sellers are exhausted.
Cycle Indicators Status
🎯 Cycle Top Dashboard
| Category | Current | Top Signal | Status |
|---|---|---|---|
| Triggered | 1 of 30 | >20 | 🟢 Early cycle |
| MVRV Z-Score | 1.21 | >5.0 | 🟢 Room to run |
| CBBI | 61 | >90 | 🟢 Mid-cycle |
| RSI (22-day) | 39.39 | >80 | 🟢 Oversold |
CoinGlass tracks 30 indicators designed to identify cycle tops. Current status: 1 of 30 triggered.
Translation: By every historical measure, we're nowhere near a cycle top.
Liquidity Dynamics
Current Situation
Net liquidity analysis (source: uploaded Fed data):
- October 29 bottom: $5,603 billion
- Current: $5,654 billion
- Change: +$51 billion
Treasury General Account (source: FRED data):
- Current balance: $900.8 billion
- Historical average: ~$700 billion
- Excess: ~$200 billion
Historical Context: 2019 QT End
When QT ended July 31, 2019:
- Bitcoin price: $10,099
- Subsequent performance: -29% over 5 months
- Key difference: Bitcoin had not yet corrected
Current situation differs:
- Bitcoin already corrected 35% before QT ends
- Liquidity already bottomed (October 29)
- Starting from oversold conditions rather than overbought
December Calendar
📅 Catalyst Timeline
| Days Out | Date | Event | Impact |
|---|---|---|---|
| 3 | Dec 1 | QT Ends | 🟢 Removes $30B/month drain |
| 12 | Dec 10 | FOMC Meeting | 🟡 87% probability 25bp cut |
| 33 | Dec 31 | Tax Loss Deadline | 🟢 Selling pressure ends |
Setup: Three major catalysts within 30 days, all potentially liquidity-positive
Market Structure Observations
Exchange Liquidations (4-hour window)
Total: $21.14 million
- Longs liquidated: $19.13 million (90.46%)
- Shorts liquidated: $2.02 million (9.54%)
Distribution by exchange:
- Binance: $9.12 million
- Bybit: $5.76 million
- OKX: $2.63 million
- Others: <$2 million combined
Positioning Metrics
- Long/Short ratio: 46.05% / 53.95% (balanced)
- BTC Open Interest: $59.64 billion (20% below October peak)
- Bitcoin Dominance: 59.21% (no altcoin season)
- Altcoin Season Index: 33 (Bitcoin season continues)
Risk Considerations
Structural Factors
- TGA Dynamics: The $900 billion Treasury balance exceeds operational norms. Historical patterns suggest normalization, but timing remains uncertain.
- Dollar Index: DXY at 99.71 presents headwinds for risk assets. Further strengthening would pressure crypto markets.
- Leverage Metrics: Current low funding and reduced OI suggest limited cascade risk, but markets can rebuild leverage quickly.
Market Conditions
The 99% reduction in liquidations, neutral funding rates, and stable open interest suggest a market that has reset from overleveraged conditions. However, thin year-end liquidity could amplify volatility in either direction.
Observable Patterns
Historical Liquidation Cycles
Major liquidation events (>$10B daily) in crypto history:
- May 2021: $8.6 billion
- September 2021: $3.65 billion
- December 2021: $2.47 billion
- May 2022: $7.82 billion
- October 2025: $19.14 billion
Current $166 million daily liquidations represent the lowest readings following any major flush event.
Sentiment Extremes
Fear & Greed at 25 marks the third-lowest reading in 2025:
- February low: 22 (preceded 45% rally)
- April low: 24 (preceded 70% rally)
- Current: 25
Historical observation: Extreme fear readings below 30 have marked significant lows more often than tops.
Technical Levels
📈 Key Price Zones
| Level | Type | Significance |
|---|---|---|
| $100,000 | 🔴 Resistance | Psychological + Options |
| $96,000 | 🟡 Resistance | Technical convergence |
| $93,000 | 🟡 Resistance | Recent local high |
| $91,161 | ⚪ Current | Trading zone |
| $88,000 | 🟢 Support | Volume shelf |
| $84,000 | 🟢 Support | November 21 bottom |
| $80,000 | 🟢 Support | Major psychological |
Summary
📍 Key Takeaways
| Signal | Data Point | Implication |
|---|---|---|
| Liquidations | $19B → $166M (-99%) | Forced selling exhausted |
| ETF Flows | -$903M → +$129M | Tide turning after capitulation |
| Funding | 0.0049% (neutral) | No leverage excess |
| Indicators | 1/30 triggered | Mid-cycle, not late-cycle |
| Institutions | 1,292 BTC bought | Sovereign/corporate accumulation |
| Treasury | $901B (excess $200B) | Major liquidity catalyst pending |
October's $19 billion liquidation cascade has normalized to $166 million daily. Funding rates near zero and stable open interest suggest derivatives excess has been purged. Fear & Greed at extreme fear while price holds above $90,000 presents a divergence worth monitoring.
Institutional accumulation during fear, $305 billion in stablecoin reserves, and approaching catalysts (QT end, FOMC) provide context for December market structure. The Treasury's $900 billion balance remains well above historical norms.
The data presents a market in transition from violent deleveraging to equilibrium. Historical patterns suggest such transitions often precede new market phases, though outcomes remain uncertain.
When forced sellers disappear and structural indicators remain cold, markets usually enter the phase where price and fundamentals reconnect. Whether that reconnection happens higher or lower depends on December liquidity flows, not October's volatility.
Educational analysis only. Not financial advice.
Sources: TradingView | CoinGlass | DeFiLlama | Alternative.me | CoinGecko | Federal Reserve Data | MarketWatch
Disclaimer: Digital assets involve substantial risk of loss. This brief provides market observations for educational purposes only. Readers should conduct independent research and consult qualified professionals before making investment decisions.